Logging service
Introduction
SoloDB supports the use of an external equipment logging service running python or any other programming language. When a measurement is executed on an equipment and a file is created containing the measurement results, the logging service can be called to process the file and send the results back to SoloDB where the results are stored in the database.
Python skeleton application
A skeleton application for the logging service is available on GitHub which can be used as a starting point to set up a logging service. In this document is explained how to set up the logging service in SoloDB and how to use it in runs.
In the demo system this skeleton application is running and the Swagger interface can be find at the following URL: https://data-processor.demo.solodb.net/doc
This service has 2 main endpoints:
preprocessing: This endpoint is used to send the raw filespostprocessing: This endpoint is used to get the results back based on the UUID (a unique token generated per analysis), this can be graphs, figures or files
Logging service in SoloDB
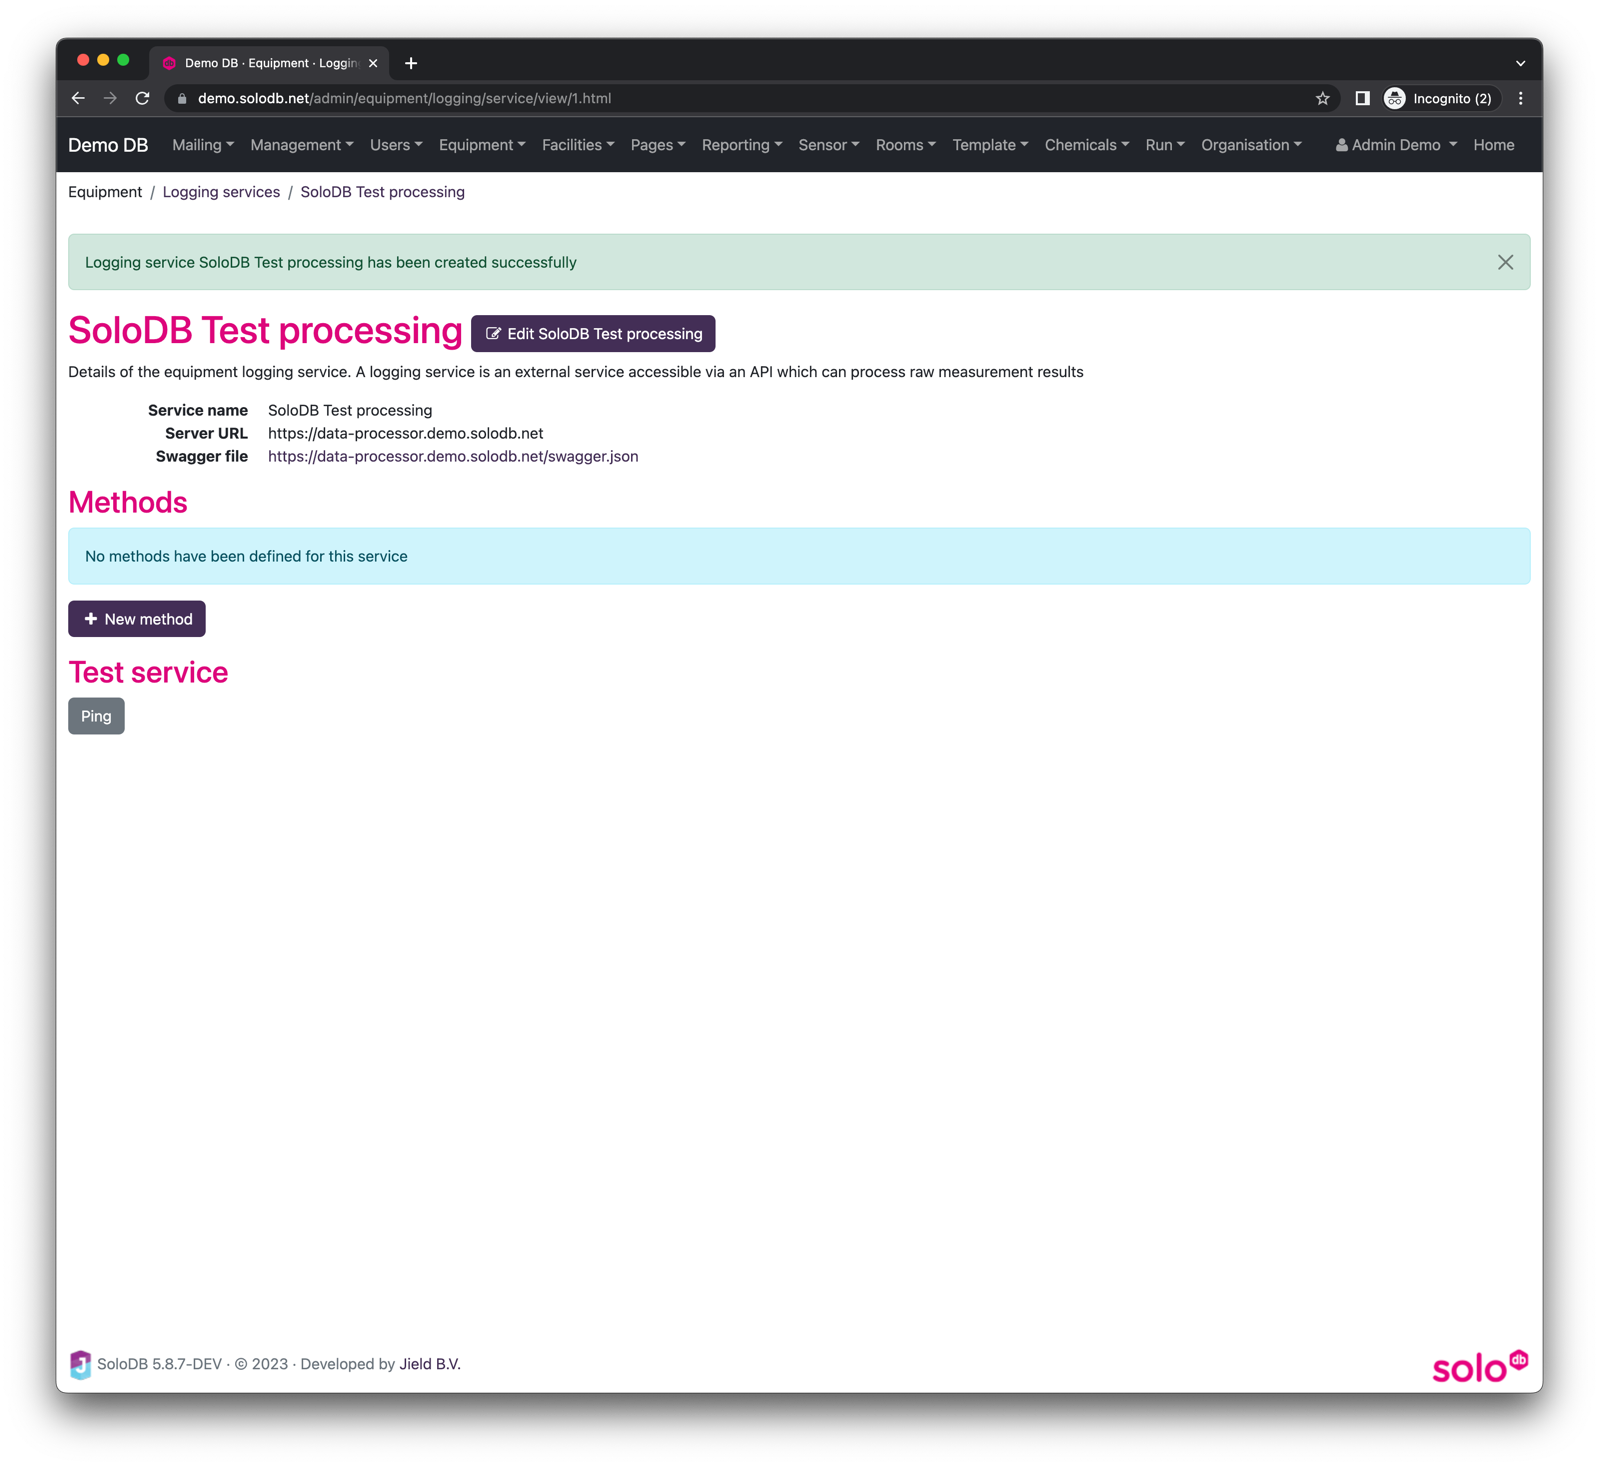
A new logging service can be created via Admin > Equipment > Logging Services and by clicking on the ```New
logging service” button. In the form the name, server ULR and link to swagger file should be given.
If this is done the index page of the Logging service is shown, see screenshot below:
Create service methods
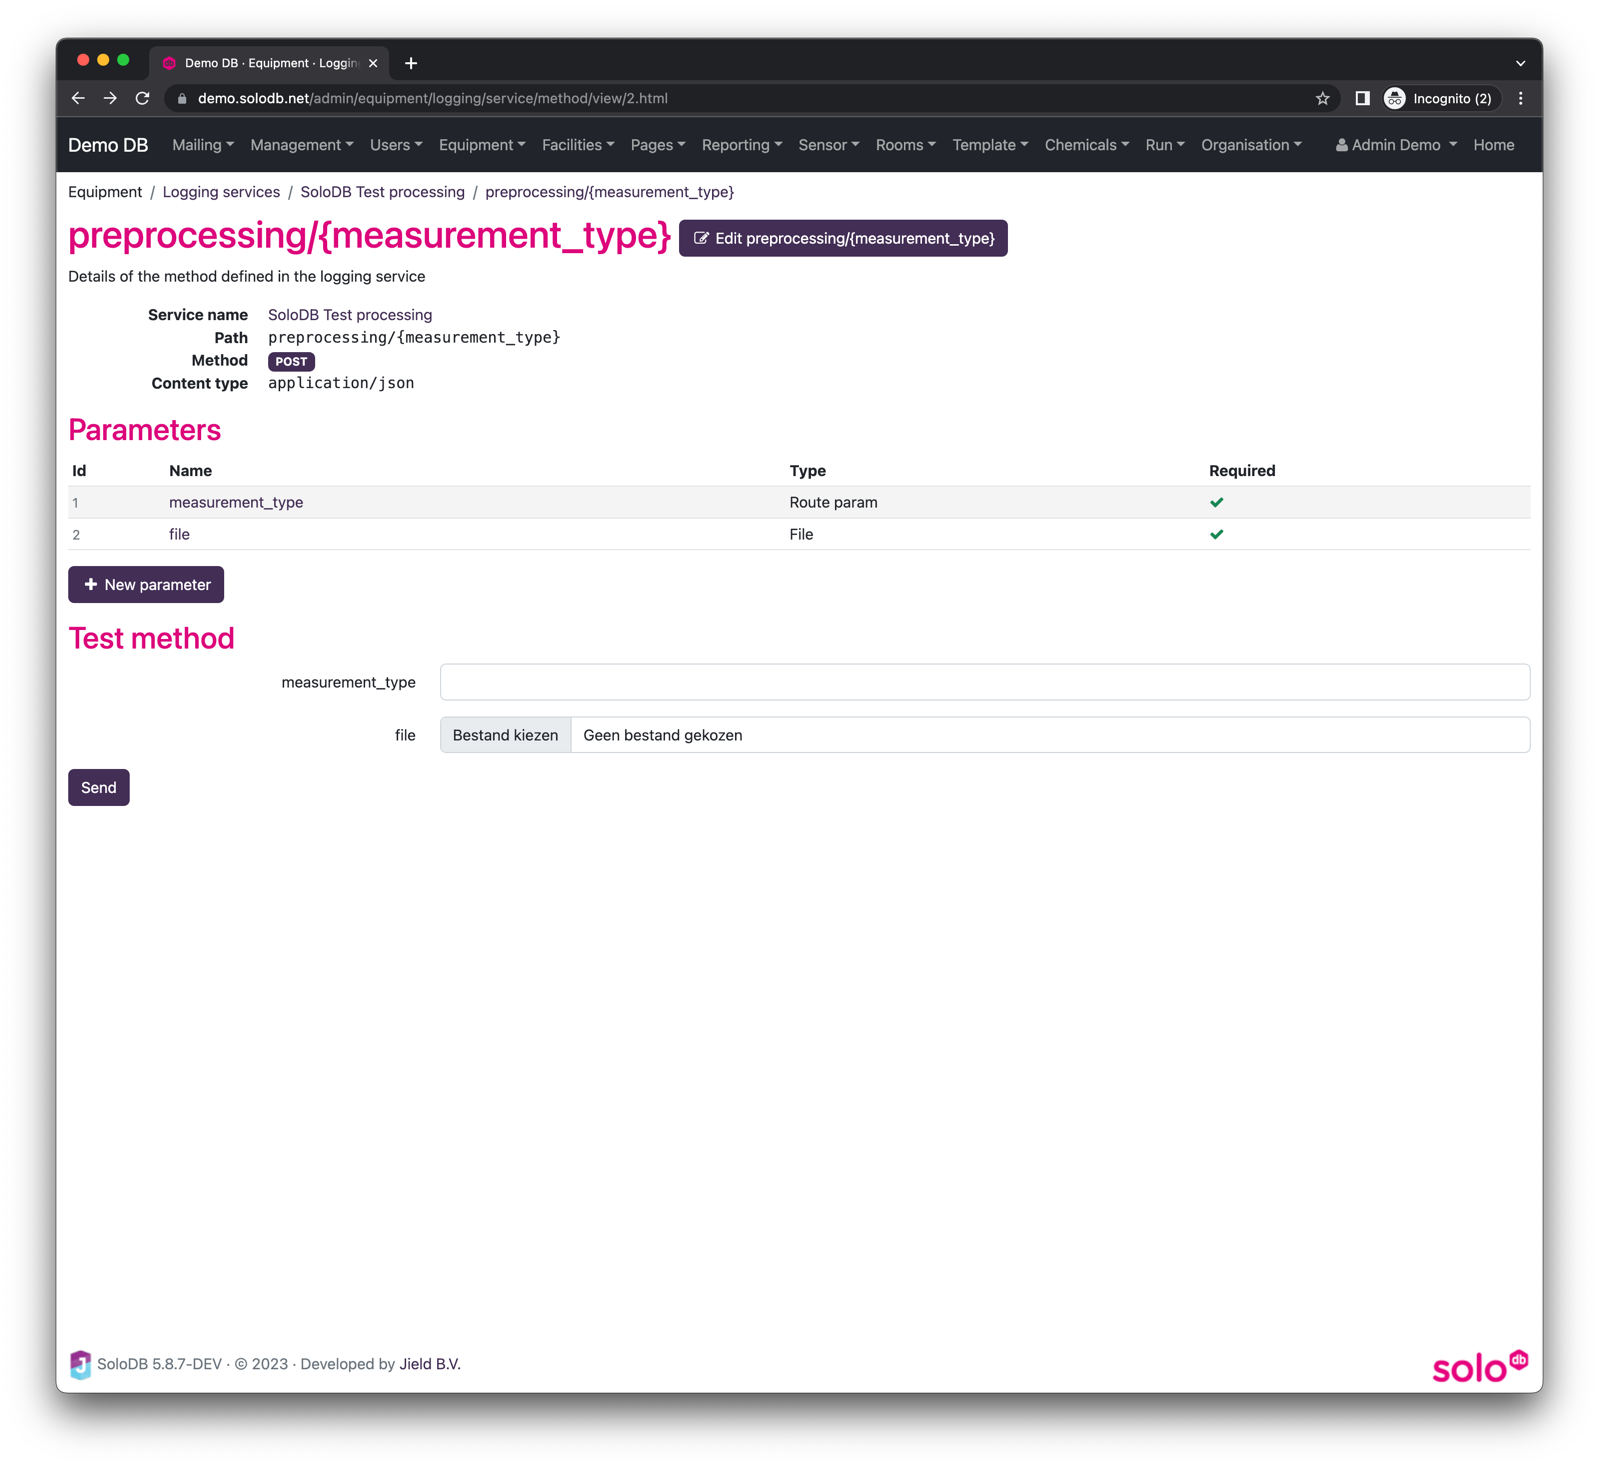
In order to use the service in SoloDB, the relevant service methods have to be created, which can be done via
the New method buttons on the logging detail page. Each method in the service which is needed in SoloDB has to be
created on this page. Per method the path, HTTP method and response type can be chosen.
If a method is created it is also possible to add parameters which are required for the method. These parameters can be
route parameters (e.g. /preprocessing/{uuid}) or post parameters which will be added in the payload. The
parameters can be added via the New parameter button. Each service method has a button to test the service and to
validate the response. Note that any route param should be wrapped with curly brackets (
e.g. {preprocessing/{measurement_type}).
On the service index page there is also a ping button to test if all the methods are working correctly. An example where some methods and parameters are defined can be found in Demo version of SoloDB. Note that the demo version will not return any real results.
To use this service in runs an equipment logging has to be created. Read more about this in the equipment logging section.